Workers Comp Insurance Cost
Pick a business type to see the published median, then type a quote to compare it.
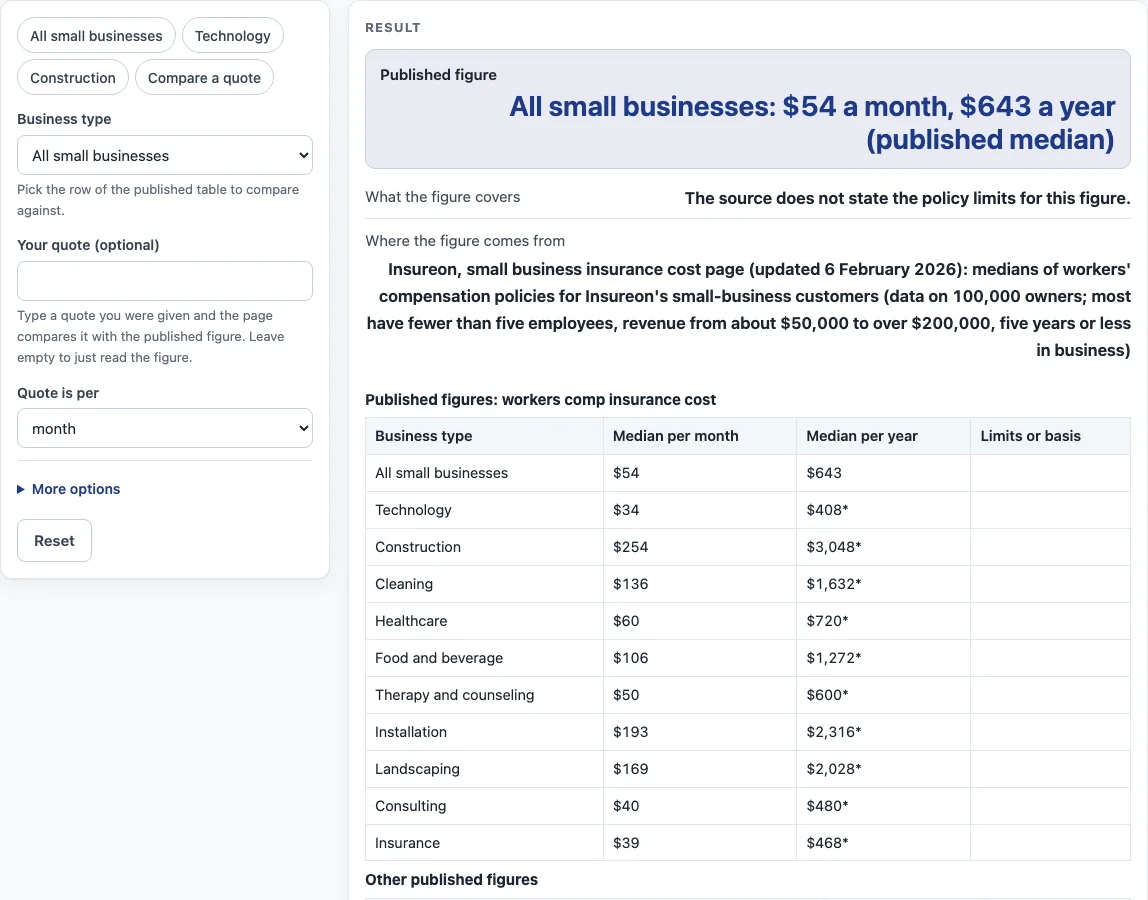
How to use the workers comp insurance cost tool
- Open the calculator at the top of this page.
- Pick the business type that fits your company. Each option matches one row of the published table, and “All small businesses” covers the whole group.
- Check the published monthly and yearly figures for that row. The “What the figure covers” line tells you whether the source gives policy limits for that row. Industry rows only publish a monthly median, so their yearly figure is that monthly amount times 12 and carries an asterisk in the table.
- If you have a quote, enter it in the quote box and select “per month” or “per year” to match the wording on the quote.
- See how far your quote sits above or below the published figure.
- For more detail, expand “More options” and input annual revenue and employee count. The result shows the published yearly figure as a share of revenue, your quote as a share of revenue if you entered one, and the cost per employee.
- Use the result only as a rough estimate, and request quotes from a licensed insurer or agent.
Calculations happen in your browser, so the figures you enter are never uploaded. The page asks for no contact details.
How is workers comp insurance cost calculated?
Insureon’s workers’ compensation page (updated 13 April 2026) sets out the premium formula as classification rate x experience modification rate x (annual payroll / $100). This tool skips that calculation: its inputs are a business type row, an optional quote, and, under “More options”, annual revenue and employees.
Three parts make up the formula: a classification rate, an experience modification rate, and annual payroll divided by $100. The source offers the formula alone, and this page shows no rates or prices any business. Treat the results as estimates, and request quotes from a licensed insurer or agent, since they hold the actual rates.
Why do published figures differ by business type and state?
Every row in the published table is a separate median for one business type, so the rows do not combine into a total. Adding separate medians does not produce the price of a bundle. Construction sits at $254 a month in the table, while consulting is $40 a month.
Insureon also publishes wider ranges on its workers’ compensation page (updated 13 April 2026): an annual range of around $300 to over $5,000, and a state range from $34 (Texas) to $127 (Alabama) a month. According to that page, 47% of customers pay less than $50 a month, and 24% pay $50 to $100 a month.
The tool shows further published figures beside the main table. State averages per month include California at $63, Florida at $65, New York at $43 and Texas at $34. Employee-count averages are $62 a month for 3 to 5 employees and $160 for 10 or more. Both sets come from the same workers’ compensation page (updated 13 April 2026), and they appear for context only, not as rows to compare against a quote.
What does a published median mean here?
A median is the middle value of the figures Insureon sorted for a group. The “All small businesses” figure of $54 a month and $643 a year therefore reflects the middle of its customers’ data, not the price of any one policy. The source publishes the yearly figure for that row, but the yearly figures for industry rows are the monthly figure times 12.
Insureon’s pages do not agree on every row. The workers’ compensation page text (updated 13 April 2026) lists construction and contracting at $179 a month and finance and accounting at $34. By contrast, the cost-by-coverage page table (updated 6 February 2026) puts construction at $254 a month and technology at $34. The tool follows that table, so construction appears as $254 a month and $3,048 a year, the monthly figure times 12.
Sources (checked 15 October 2026): insureon.com · insureon.com
Worked examples
| Input | Result |
|---|---|
| All small businesses | All small businesses: $54 a month, $643 a year (published median) |
| All small businesses, quote $70 per month | Your quote of $70 a month ($840 a year) is 30.6% above the published median of $54 a month. |
| Technology, revenue $120,000 | Technology: $34 a month (published median), about $408 a year (12 x the monthly figure) |
| All small businesses, revenue $150,000 | All small businesses: $54 a month, $643 a year (published median) |
Calculated by the tool above; open it with the same values to see each step.
Frequently asked questions
Is the workers comp insurance cost tool free?
Correct, it costs nothing to use. No account is required, and the calculations run in your browser. Nothing you type is uploaded.
Does the tool give me a price for my business?
The tool doesn’t do that. Instead, it displays published medians and sets them beside a quote you enter. It makes no estimate of its own and issues no quote. Treat the output as a rough comparison only, and request actual quotes from a licensed insurer or agent.
Where do the published figures come from?
Insureon’s small business insurance cost page, last updated 6 February 2026, is the source. Its sample includes 100,000 owners, the majority employing fewer than five people, with annual revenue ranging from roughly $50,000 to above $200,000 and operating five years or less.
Why is “All small businesses” not the sum of the other rows?
The “All small businesses” line carries a median of its own: $54 a month and $643 a year. Every other row reflects a distinct median for a single business type. Adding those medians together does not produce a bundle price.
What do “per month” and “per year” change?
The selector fixes the unit applied to your quote. Pick whichever matches the quote in hand, and the comparison against the published figure will use the same basis.
Why do Insureon’s pages list different construction figures?
Insureon’s workers’ compensation page text (updated 13 April 2026) lists construction and contracting at $179 a month. Its cost-by-coverage table (updated 6 February 2026), however, puts construction at $254 a month. The tool relies on the table, so construction appears as $254 a month and $3,048 a year, the monthly figure multiplied by 12.
Related tools
- Business Insurance Costs: Pick this if you want every business insurance cost tool gathered in one place.
- Workers Comp Calculator: Open this for the workers’ compensation calculator, instead of the published-figure comparison on this page.
- Small Business Insurance Cost: Good for published figures covering small business insurance overall.
- BOP Insurance Cost: Your question concerns business owner’s policy figures? Start here.
- General Liability Insurance Cost: Comparing published figures for general liability coverage? This is the page.
- Commercial Auto Insurance Cost: For questions about commercial vehicle coverage, this one fits.
- Commercial Property Insurance Cost: Looking at published figures for commercial property is the job here.
- Cyber Liability Insurance Cost: Cyber liability coverage is the subject of this tool.
- Errors and Omissions Insurance Cost: Published figures for errors and omissions coverage sit side by side here, so compare them.