Whole Life Insurance Cost Calculator
Copy the annual premium and the cash values for up to five policy years from your illustration; the page shows premiums paid, cash value against them, the implied yearly return and the break-even year.
How to use the Whole Life Insurance Cost Calculator
- Open the policy illustration you received and find the annual premium. Type it into “Annual premium ($)”.
- If the illustration shows a death benefit, type it into “Death benefit ($, optional)”. Leave it empty if you only want the premium and cash value results.
- Under “The cash values you typed are”, choose “Guaranteed”, “Not guaranteed” or “Total as illustrated”. The label only names the column you typed, so pick the one that matches the illustration’s wording.
- In “Policy year and cash value, one per line (up to 5)”, type a policy year and its cash value separated by a comma, for example 5, 9000. Use the years and values exactly as the illustration shows them.
- Optional: type a percentage into “Your own alternative return (% a year, optional)” to see the same premiums compounded at that rate. Leave it empty or at 0 to skip the comparison.
- Read the results: premiums paid, the cash value as a share of premiums paid, the implied annual return, premiums paid less cash value, the break-even year, and the premium per $1,000 of death benefit. With an alternative return, it also shows the difference to the last cash value.
- Check the warnings. The page flags a last cash value above the death benefit, and it reminds you that values not guaranteed can differ from what the policy later pays.
- Compare the results with the illustration’s notes on which premiums and values are not guaranteed.
How is the implied annual return worked out?
The tool finds the single yearly rate that makes your premiums, each compounded forward, equal the cash value you typed. It assumes each premium is paid at the start of every year up to the typed year y, so premiums paid equal the annual premium multiplied by y.
The rate r is solved with the formula premium x ((1+r)^y - 1) / r x (1+r) = cash value. When r is 0, the formula becomes premium x y, which is the same as the premiums paid. The tool uses bisection, a method that keeps halving a range between -99% and +100% until the answer is within 1e-7. If no rate fits, such as when the cash value is $0, the result shows a dash.
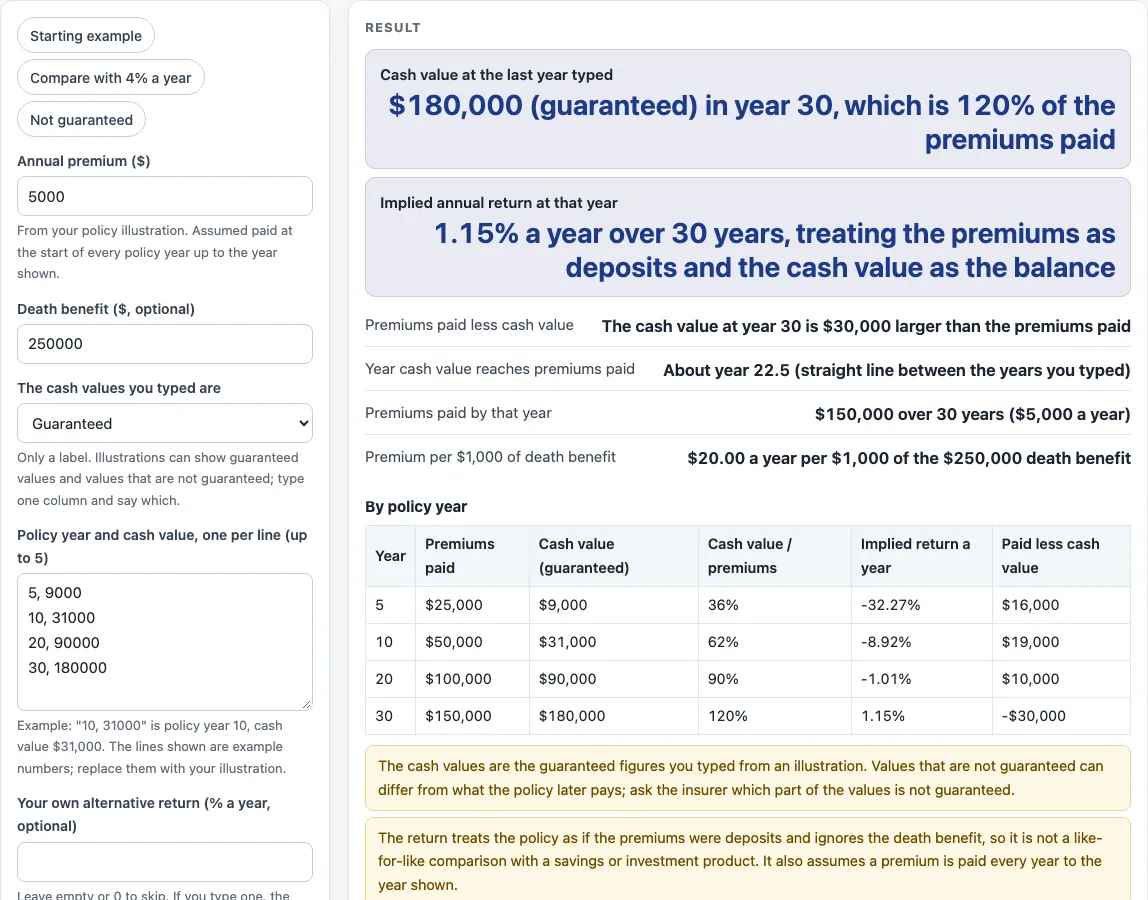
Using the default example numbers of $5,000 a year (not a real policy), the premiums paid by year 30 are $150,000. A cash value of $180,000 is 120% of those premiums, which gives an implied return of 1.15% a year. You can check the method with a smaller case. With $1,000 a year and cash values of $1,100 at year 1 and $2,310 at year 2, the result is exactly 10% a year. The implied return ignores the death benefit and is not a like-for-like comparison with a savings product.
When is the break-even year reached?
The break-even year is the first year in which the cash value reaches the premiums paid. The tool finds it by straight-line interpolation between the years you typed, using an extra point at year 0 where nothing has been paid and nothing has built up.
In the default example, year 20 has premiums of $100,000 and a cash value of $90,000, a gap of -$10,000. Year 30 has premiums of $150,000 and a cash value of $180,000, a gap of +$30,000. The gap moves from negative to positive as 10 years pass by, so the crossing point is 20 + 10 x 10,000 / 40,000, which is year 22.5. If your first typed year already has a cash value at or above the premiums paid, the page says that earlier years are not known.
The page shows premiums paid less cash value, which is the cost if you surrender. In the default example, that is $150,000 minus $180,000, so the cash value is $30,000 above the premiums paid, and the page shows it that way. An alternative return works differently: it compounds the same premiums at the rate you type. At 4%, the same premiums reach $291,642 after 30 years, which is $111,642 above the $180,000 cash value. No default rate is suggested, and an empty or 0 field shows nothing. This is an estimate only; get quotes from a licensed insurer or agent.
Sources (checked 15 October 2026): insurance.ky.gov
Worked examples
| Input | Result |
|---|---|
| $5,000 a year, cash values up to year 30 | implied return 1.15% a year, premiums less cash value -$30,000 |
| $5,000 a year, cash values up to year 30 | implied return 1.15% a year, premiums less cash value -$30,000 |
| $2,400 a year, cash values up to year 20 | implied return 0.76% a year, premiums less cash value -$4,000 |
| $1,000 a year, cash values up to year 2 | implied return 10.00% a year, premiums less cash value -$310 |
Calculated by the tool above; open it with the same values to see each step.
How this tool works and where the numbers come from
The calculator works on the premium, death benefit and cash values you copy from a policy illustration. It finds the single yearly rate r that solves premium x ((1+r)^y - 1) / r x (1+r) = cash value (premiums paid at the start of each year, solved by bisection), the cash value as a share of premiums paid, the break-even year by straight-line interpolation, and the premium per $1,000 of death benefit. It does not price policies and cannot tell which values are guaranteed; that comes from the illustration.
Sources
Frequently asked questions
What does the whole life insurance cost calculator actually calculate?
It works on the annual premium, death benefit, and cash values you copy from a policy illustration. It shows premiums paid, the implied annual return, the cost if you surrender, the break-even year, and the premium per $1,000 of death benefit. It does not price policies.
Why does the label on the cash-value column matter?
The label only names the column you typed, such as “guaranteed” or “not guaranteed.” The NAIC Life Insurance Buyer’s Guide (2018) asks buyers to find out which part of premiums or policy values is not guaranteed and to ask for an illustration of future values. Use the label that matches the illustration.
What does a dash in the implied annual return mean?
A dash means no rate fits the figures you typed. This happens when the cash value is $0, for example. Check the cash values and years you entered.
Does the implied return include the death benefit?
No. The implied annual return only compares premiums with the cash value. The death benefit is shown separately, and only as the premium per $1,000 of death benefit a year.
Is the alternative return a rate the tool recommends?
No. The alternative return is a rate you type in as a percentage a year, and the tool does not suggest one. Leaving it empty or entering 0 shows nothing.
Is this a quote?
No. The results on this page are estimates only, not a quote and not advice. Ask a licensed agent or advisor about your own situation.
Related tools
- All Life Insurance Calculators: the hub with every life insurance page on this site.
- Life Insurance Cost Calculator: Use it when you want a general cost estimate across life insurance types rather than figures from a whole life illustration.
- How Much Life Insurance Do I Need?: Use it to work through coverage amount questions, separate from the cost figures on this page.
- Mortgage Life Insurance Calculator: Use it if your question is about life insurance tied to a mortgage.
- Term Life Insurance Calculator: Use it when you are looking at term coverage, which mostly has no cash value (NAIC Buyer’s Guide, 2018).
- Home and Rental Coverage: Worksheets for homeowners, renters and landlords.