Small Business Insurance Cost
Tick the coverages you are budgeting for to add up the published monthly and yearly medians, and type a quote to compare.
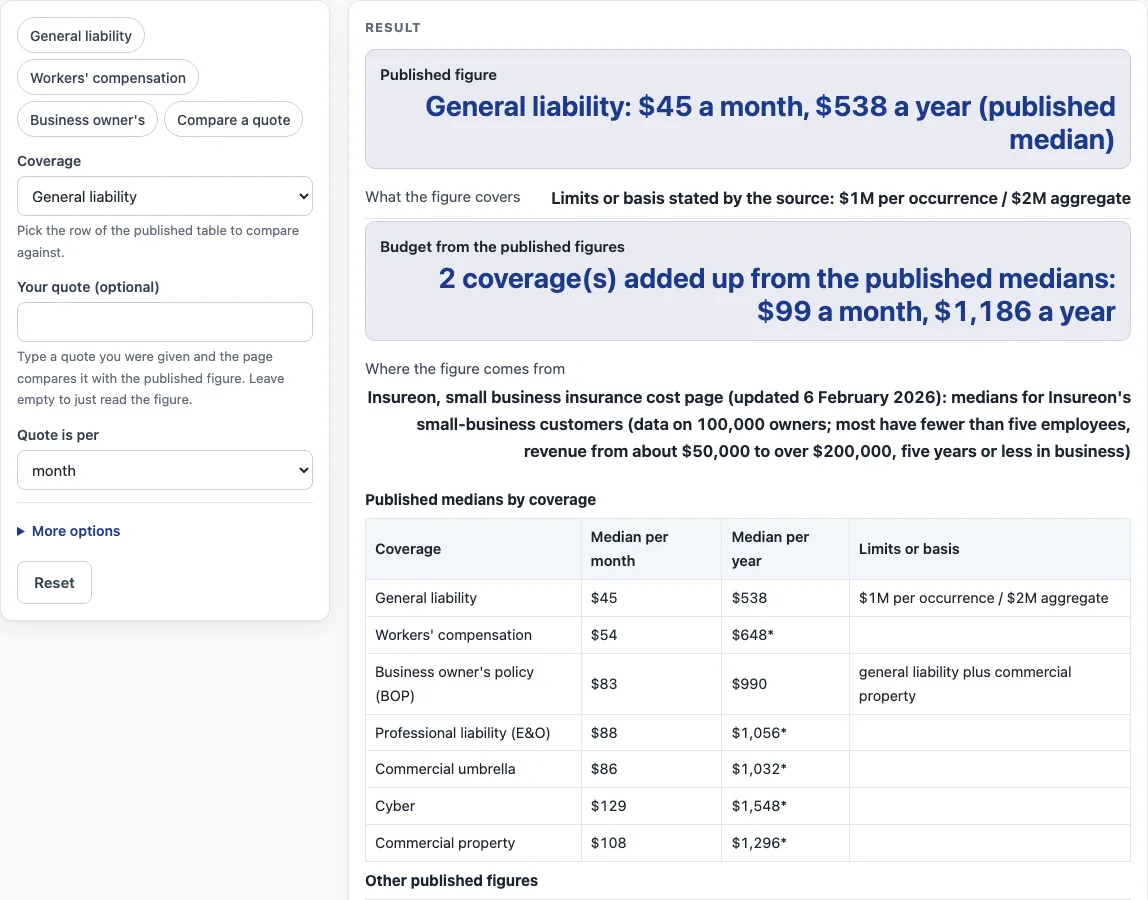
How to use the Small Business Insurance Cost Tool
- Open the tool at the top of this page.
- Choose the coverage row you want from the published table, such as General liability or Cyber.
- Read the published figure, shown per month and per year. Check the “What the figure covers” line, which shows limits only where the source states them. For example, General liability shows $1M per occurrence / $2M aggregate. Other rows show the monthly figure times 12 as the yearly one, marked with an asterisk.
- To compare, type your quote into the quote field and choose “per month” or “per year” to match the quote you have.
- Open “More options” to enter your annual revenue, your number of employees, and which coverages to add to the budget.
- Add each coverage to the budget only once. A business owner’s policy (BOP) already includes general liability and commercial property, so ticking all three counts the same cover twice.
- Read the result. It shows how far your quote is above or below the published figure. If you typed revenue and employees, it also shows the share of revenue and the amount per employee, based on the budget total, and your quote as a share of revenue.
- Treat the result as an estimate only; get quotes from a licensed insurer or agent.
The tool runs entirely in your browser, so nothing you type is uploaded. No sign-up or contact details are required.
What does the published figure on this page show?
The published figure is a median taken from Insureon’s data for each coverage row. It is shown per month and per year. Limits are listed only where the source states them, such as $1M per occurrence / $2M aggregate for general liability. The page adds no figure of its own.
Where do the numbers come from?
Every figure comes from Insureon’s small business insurance cost page, updated 6 February 2026. The data covers 100,000 small business owners. Most have fewer than five employees, 57% have one employee, and 69% have been in business for five years or less. Average revenue in the data is $80,000. Insureon also states an average general liability deductible of $500.
Why does this page say “median” when the source says “average”?
Insureon’s page uses “median” in its table heading and “average” in its intro text. This page uses “median” because that is the term in the table heading. A median is the middle value when all results are sorted from lowest to highest, so it is not the same as an arithmetic average.
Why is a total of separate figures not the price of a bundle?
If you add up the figures for several coverages, you get a sum of separate medians. That sum is not the price of a bundle. This page says so too. The BOP already includes general liability and commercial property, so ticking all three in the budget counts the same cover twice.
How is my quote compared with the published figure?
The tool converts your quote to a yearly amount and shows the difference from the published figure as a percentage above or below it. When you enter annual revenue, it divides the published yearly total of the coverages added to the budget by your revenue to give a share of revenue, and a separate line divides your annual quote by your revenue. When you enter employees, it divides the budget total by the number of employees to give an amount per employee.
Why might the monthly and yearly figures not match exactly?
Only General liability ($538) and the BOP ($990) have a published yearly figure; for the other coverages the tool shows the monthly figure times 12. Multiplying a monthly figure by 12 can differ slightly from a published yearly figure: General liability is $45 per month, and 12 times $45 is $540, while the published yearly figure is $538.
Sources (checked 15 October 2026): insureon.com
Worked examples
| Input | Result |
|---|---|
| General liability | 2 coverage(s) added up from the published medians: $99 a month, $1,186 a year |
| General liability, quote $60 per month | Your quote of $60 a month ($720 a year) is 33.8% above the published median of $45 a month. |
| Workers' compensation, revenue $120,000 | 2 coverage(s) added up from the published medians: $99 a month, $1,186 a year |
| General liability, revenue $150,000 | 2 coverage(s) added up from the published medians: $99 a month, $1,186 a year |
Calculated by the tool above; open it with the same values to see each step.
Frequently asked questions
Frequently asked questions
What is the published small business insurance cost for general liability?
The published median from Insureon’s page (updated 6 February 2026) is $45 per month or $538 per year. The row lists limits of $1M per occurrence and $2M aggregate. These are published figures, not a quote.
Who is in the data behind these figures?
The data covers 100,000 small business owners. Most have fewer than five employees, and revenue runs from about $50,000 to over $200,000.
Does this tool tell me which coverage I need?
No. The tool shows published figures and compares them with a quote you type in. It does not recommend coverages, amounts or limits.
How much should business insurance cost?
The tool does not say what your cost should be. It shows published figures from Insureon and how your quote compares with them. Your actual cost depends on your own business, which a licensed insurer or agent can assess.
Can I get a quote through this site?
No. The page does not give quotes, refer you to insurers or sell leads. Quotes come from a licensed insurer or agent.
Is anything I type sent anywhere?
No. Everything is calculated in your browser, and the page does not ask for contact details.
Is there a small business insurance calculator?
This page works as a budget calculator. Tick the coverages you are considering and the tool adds up their published monthly and yearly medians, then compares a quote you type in. It does not calculate a premium from your revenue, location or claims, so the total is a rough budget and not a price. Get quotes from a licensed insurer or agent.
Related tools
- Business Insurance Costs: use this to find every business insurance cost tool in one place.
- BOP Insurance Cost: use this to read the published figure for a business owner’s policy.
- Commercial Auto Insurance Cost: use this to look at the cost information for vehicles used for business.
- Commercial Property Insurance Cost: use this to look at the cost information for business property.
- Cyber Liability Insurance Cost: use this to read the published figure for cyber cover.
- Errors and Omissions Insurance Cost: use this to read the published figure for professional liability.
- General Liability Insurance Cost: use this to read the published figure for general liability.
- Workers Comp Calculator: use this to work through workers’ compensation figures step by step.
- Workers Comp Insurance Cost: use this to read the published figure for workers’ compensation.