Retail store insurance cost
Pick a coverage to see the published figure, type a quote to compare, and tick coverages to add up a yearly budget.
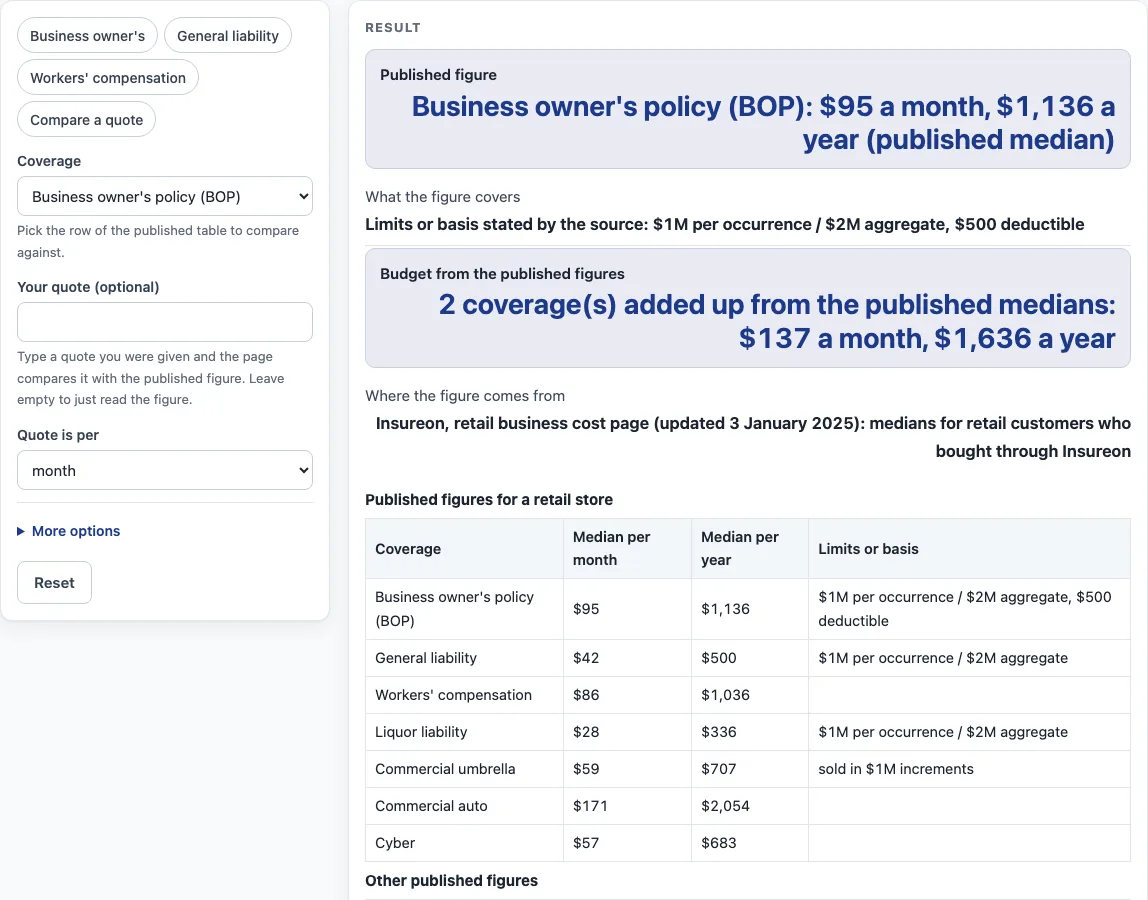
How to use the retail store insurance cost tool
- Locate the row in the published table that matches the coverage you’re reviewing. The rows are business owner’s policy (BOP), general liability, workers’ compensation, liquor liability, commercial umbrella, commercial auto and cyber.
- Check the published figure in that row, given per month and per year. Where the source lists limits for that row, they appear alongside it.
- Got a quote? Enter it and pick “per month” or “per year” so it matches the way the quote is written.
- Compare the two numbers. The result shows by how much your quote sits above or below the published figure.
- To add annual revenue and employee count, open “More options”. The tool then works out share of revenue and amount per employee from the coverages selected for the budget.
- Still in “More options”, pick the coverages you want in the budget. BOP and general liability start out ticked, and the tool adds the published figures for whichever rows you select.
- Selecting several coverages triggers a warning that adding separate medians gives only a rough budget. When your quote is far from the published figure, the tool recommends confirming the period and the limits included in the quote.
- Treat every result as an estimate only. Speak with a licensed insurer or agent to get an actual quote.
Your entries stay in your browser. Nothing is uploaded.
What does the published retail store insurance cost figure show?
The numbers come from Insureon’s retail business cost page, last updated 3 January 2025, and they are published medians. They describe retail customers who bought through Insureon, so treat them as a reference point rather than a price for your business. The source says average monthly costs in one place and median in its methodology, so its wording varies; this tool calls the figures published medians. The source also lists monthly figures of $160 for a BOP for a liquor store and $52 for a BOP for a candle shop, which the tool shows under other published figures.
Each row lists a monthly figure and a yearly figure as the source gives them. Multiplying the monthly figure by 12 does not always land on the yearly one. The business owner’s policy row shows $95 per month and $1,136 per year, while 12 times $95 is $1,140. When you compare a quote, match the figure to the quote’s format.
Limits appear only where the source states them. The BOP shows $1M per occurrence / $2M aggregate with a $500 deductible. General liability and liquor liability show $1M per occurrence / $2M aggregate. Commercial umbrella is sold in $1M increments. No limits are stated for workers’ compensation, commercial auto or cyber, so the tool shows none for them.
How do the share-of-customers figures work?
The source also reports the share of retail customers who paid under certain monthly amounts. For the BOP, 52% pay less than $100 a month and 79% pay less than $200 a month. Among general liability buyers, 65% pay less than $50 a month and 88% pay less than $100 a month. Workers’ compensation customers show 55% under $50 a month and 84% under $100 a month. These percentages describe the customers the source counted. They show how spread out the costs are, not a range your quote should fall into.
Why isn’t the total of several rows the price of a bundle?
Every row stands alone as its own median. Totaling the rows you select under “More options” yields a budget figure, yet that figure does not price a bundle. The page states this itself, so treat the sum as a loose guide only.
How are the gap, revenue share and per-employee amount calculated?
Your quote is converted into a yearly amount and set against the published yearly figure. The gap appears as a percentage above or below, or as a match. Pick “per month” or “per year” based on how the quote is written.
Revenue share equals the yearly total of the coverages ticked for the budget, divided by annual revenue. The per-employee amount uses that same yearly total, divided by the number of employees. Both are arithmetic results from your inputs, and your browser does all the calculating.
Sources (checked 15 October 2026): insureon.com
Worked examples
| Input | Result |
|---|---|
| Business owner's policy (BOP) | 2 coverage(s) added up from the published medians: $137 a month, $1,636 a year |
| Business owner's policy (BOP), quote $120 per month | Your quote of $120 a month ($1,440 a year) is 26.8% above the published median of $95 a month. |
| General liability, revenue $120,000 | 2 coverage(s) added up from the published medians: $137 a month, $1,636 a year |
| Business owner's policy (BOP), revenue $150,000 | 2 coverage(s) added up from the published medians: $137 a month, $1,636 a year |
Calculated by the tool above; open it with the same values to see each step.
Frequently asked questions
Frequently asked questions
Is the retail store insurance cost figure an average?
The figures are published medians from Insureon’s retail business cost page, updated 3 January 2025. The source gives average monthly costs in one place and medians in its methodology, and this tool labels them published medians.
Does this tool give me a quote?
No, it doesn’t. It shows published figures and sets them beside a quote you type in. It recommends no insurer and produces no quote, since quotes come from a licensed insurer or agent.
Is anything I type sent anywhere?
All calculations happen in your browser, and nothing is uploaded. The page never asks for contact details.
Why does my quote differ from the published figure?
Published figures are medians for retail customers who bought through Insureon. Your quote reflects details the tool does not have, so the gap only shows how far your quote sits above or below the figure.
Which limits do the figures cover?
The source states limits only where it says so. Its listing for the business owner’s policy, general liability and liquor liability shows $1M per occurrence / $2M aggregate. That policy also carries a $500 deductible. Commercial umbrella comes in $1M increments. The source gives no limits for workers’ compensation, commercial auto or cyber.
Can I add my annual revenue and employees?
Yes. Expand “More options” to enter annual revenue and employees. Based on the coverages ticked for the budget, the tool then shows share of revenue and amount per employee. These results are calculated only from the numbers you enter.
Related tools
- Auto repair shop insurance cost: built for auto repair shops.
- Bakery insurance cost: meant for bakeries.
- Cleaning Business Insurance Cost: for owners of cleaning businesses.
- Coffee shop insurance cost: aimed at coffee shops.
- Contractor Insurance Cost: this one suits businesses that work as contractors.
- Daycare Insurance Cost: the right pick if you operate a daycare.
- Business Insurance for Electricians Cost: for electrician businesses.
- Food Truck Insurance Cost: made for food trucks.
- Insurance cost by trade: Open this to browse every trade and small business cost tool in one list.
- Business insurance costs: Choose this for the general business coverage cost tools.