Restaurant Insurance Cost
Pick a coverage to see the published figure, type a quote to compare, and tick coverages to add up a yearly budget.
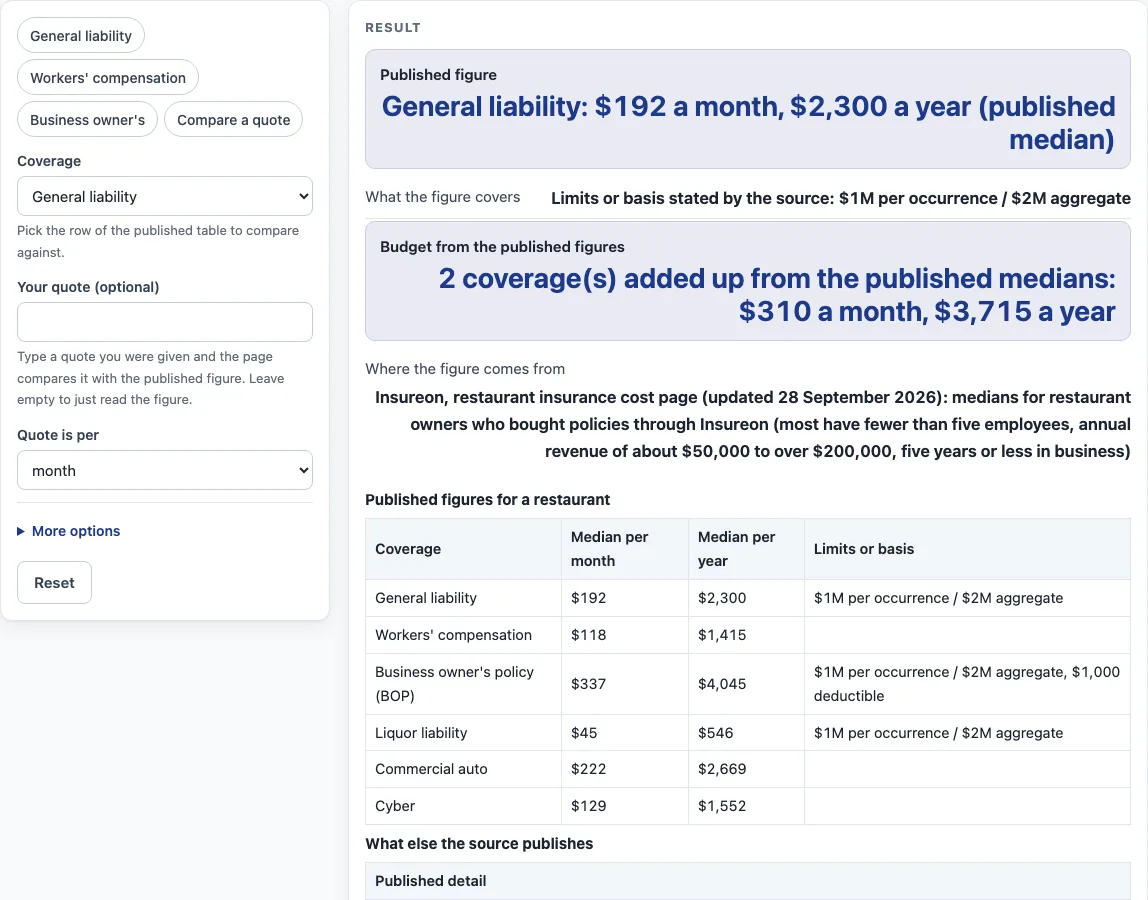
This page shows published restaurant insurance cost figures and compares them with a quote you type in. The figures are published medians from Insureon, listed by coverage: general liability, workers’ compensation, business owner’s policy (BOP), liquor liability, commercial auto and cyber. The source’s only bar-related figure is the liquor liability row, and the tool covers searches such as bar insurance cost with it. The source also calls its figures averages.
The tool runs in your browser. It is free, there is no sign-up, and it does not ask for contact details. Results are an estimate only; get quotes from a licensed insurer or agent.
How to use the restaurant insurance cost tool
- Under “Coverage”, pick the row of the published table for the coverage you want to look at: general liability, workers’ compensation, business owner’s policy (BOP), liquor liability, commercial auto or cyber.
- Read the published figure per month and per year for that row.
- Read the limits shown beside the figure, where the source states them. General liability, BOP and liquor liability show $1M per occurrence / $2M aggregate. BOP also shows a $1,000 deductible.
- If you have a quote, type it into “Your quote (optional)” and set “Quote is per” to month or year to match how the quote is written.
- Read “Your quote against it”, which shows how far the quote is above or below the published figure.
- Open “More options” if you want to add annual revenue, number of employees, or which coverages to add to the budget.
- If you typed annual revenue or employees, read “Share of revenue” and “Per employee”. Both use the ticked budget total, not your quote.
- Keep in mind that every result is an estimate. A sum of separate rows is not the price of a bundle, and the page gives no quote of its own. Everything runs in your browser, and nothing you type is uploaded.
Where do the restaurant insurance cost figures come from?
The figures come from one source: Insureon’s restaurant insurance cost page, updated 28 September 2026. This tool does not add an estimate of its own. Every figure is a published median or range from that page, and the page gives no quote.
Which restaurants are the published figures based on?
The medians describe restaurant owners who bought policies through Insureon. Most of them have fewer than five employees, annual revenue of about $50,000 to over $200,000, and five years or less in business. A restaurant outside that group may see a different figure. The tool cannot tell you which figure fits your business.
Why is a median not the same as a price?
A median is the middle value in a set of figures, so half of the buyers in the source paid more and half paid less. It is not a price you will be charged. Insureon’s liquor liability figure is worded as “Most businesses pay around $150 to over $4,000 per year, depending on their unique business risks,” which shows how wide the range can be.
How does the tool compare a quote with a published figure?
The tool takes the quote you type, turns a monthly quote into a yearly one by multiplying by 12, and compares it with the published yearly figure for the same row. If the quote is higher, the result shows by what percentage it is above the figure. If it is lower, it shows the percentage below. The comparison is only as close as the coverage matches the row, and the table shows the limits and deductible where the source states them.
When you type annual revenue, the tool shows the ticked budget total as a share of that revenue. When you type a number of employees, it shows that total per employee. These are simple arithmetic results from the numbers you entered.
Why does a sum of separate figures not give a bundle price?
Each row is a separate median for one coverage. Adding them together does not give the price of a bundle. The “More options” budget adds the rows you tick, and the tool shows a note that one insurer pricing a bundle can differ from the sum and that your own quotes decide.
What factors does Insureon list as changing restaurant insurance cost?
Insureon lists restaurant type (for example fast food versus cafe), property and kitchen equipment value, location, number of employees, size and revenue, limits and deductibles, operation type such as franchise, coverages bought, and claims history. The tool does not score these factors for you. This is an estimate only; get quotes from a licensed insurer or agent.
Sources (checked 15 October 2026): insureon.com
Worked examples
| Input | Result |
|---|---|
| General liability | 2 coverage(s) added up from the published medians: $310 a month, $3,715 a year |
| General liability, quote $240 per month | Your quote of $240 a month ($2,880 a year) is 25.2% above the published median of $192 a month. |
| Workers' compensation, revenue $120,000 | 2 coverage(s) added up from the published medians: $310 a month, $3,715 a year |
| General liability, revenue $150,000 | 2 coverage(s) added up from the published medians: $310 a month, $3,715 a year |
Calculated by the tool above; open it with the same values to see each step.
Frequently asked questions
Is restaurant insurance cost the same for every restaurant?
No. The published figures are medians for a specific group of Insureon customers. Your quote can differ because of the factors Insureon lists, such as restaurant type, location and claims history.
Does this tool give me a quote?
No. The tool only shows published figures and compares them with a quote you already have. Quotes come from a licensed insurer or agent.
Which limits does the table show?
General liability, BOP and liquor liability show $1M per occurrence / $2M aggregate, and the BOP row also shows a $1,000 deductible. The tool shows limits only where the source states them.
Why might the figure be different from an older search result?
Search-result text for an earlier Insureon restaurant page gave a BOP of $251 a month ($3,010 a year) and liquor liability of $45 a month. The BOP figure here is $337 a month, from the page opened on 15 October 2026, so sources differ by date.
Are these figures for bars?
The page includes liquor liability, which is the row bar owners usually look at. The other rows apply to restaurants in general. The source’s medians cover restaurant owners, not bars as a separate group.
Is my information sent anywhere?
Everything is calculated in your browser, and nothing is uploaded. The page does not ask for contact details, sell leads or refer you to insurers.
Related tools
- Insurance cost by trade: the hub listing every trade page with published figures.
- Business insurance costs: the hub for coverage-type pages such as general liability and workers’ comp.
- Food Truck Insurance Cost: use it if your restaurant operates from a mobile kitchen.
- Coffee shop insurance cost: use it if your food service is mostly drinks and light snacks.
- Bakery insurance cost: use it if your business centers on baked goods.
- Retail store insurance cost: use it to compare published figures for a shop.
- Hair salon insurance cost: use it to compare published figures for another service business.
- Daycare insurance cost: use it to compare published figures for a childcare business.