Real Estate Agent Insurance Cost
Pick a coverage to see the published figure, type a quote to compare, and tick coverages to add up a yearly budget.
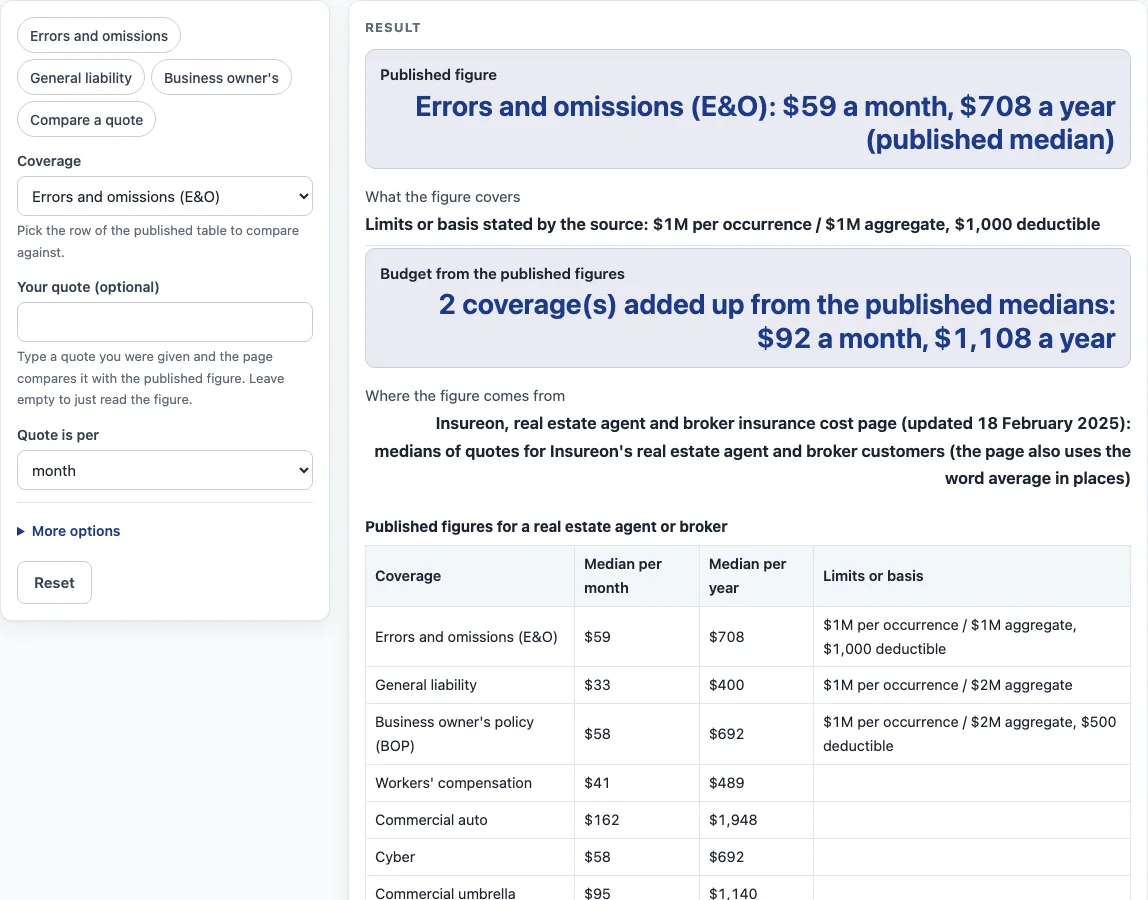
How to use the real estate agent insurance cost tool
- Choose a row from the published table. The rows are errors and omissions (E&O), general liability, business owner’s policy (BOP), workers’ compensation, commercial auto, cyber, commercial umbrella, surety bond and commercial package policy (CPP).
- Read the published figure for that row, shown per month and per year. Where the source states limits, they appear with the figure.
- To check a price, type your quote and choose “per month” or “per year” to match the amount on your quote.
- Read the result. It shows how far your quote is above or below the published figure.
- Open “More options” and enter annual revenue. The tool then shows the share of revenue, worked out from the coverages ticked for the budget.
- In “More options”, enter your employees to see the amount per employee, worked out the same way.
- In “More options”, choose which coverages to add to the budget. The budget starts with errors and omissions and general liability ticked. Remember that a sum of separate medians is not the price of a bundle, and the tool warns about this when you tick more than one.
- Treat the result as an estimate. Quotes come from a licensed insurer or agent.
“More options” is optional, so the published figures work on their own. Your numbers are calculated in your browser and are not uploaded.
What do the published figures for real estate agent insurance cost mean?
The figures are published medians from Insureon’s real estate agent and broker insurance cost page, updated 18 February 2025. The source builds its figures from quotes for its real estate agent and broker customers. It uses the word “average” in places, but this tool treats every figure as a published median.
Which coverages does the published table include?
The table lists nine rows, each shown per month and per year:
- Errors and omissions (E&O): $59 per month, $708 per year
- General liability: $33 per month, $400 per year
- Business owner’s policy (BOP): $58 per month, $692 per year
- Workers’ compensation: $41 per month, $489 per year
- Commercial auto: $162 per month, $1,948 per year
- Cyber: $58 per month, $692 per year
- Commercial umbrella: $95 per month, $1,140 per year
- Surety bond: $8 per month, $100 per year
- Commercial package policy (CPP): $278 per month, $3,330 per year
The tool also lists published monthly E&O and general liability figures for ten states. The source publishes no yearly values for those.
Which limits does the page show?
Limits are shown only where the source states them. E&O shows $1M per occurrence and $1M aggregate with a $1,000 deductible. General liability shows $1M per occurrence and $2M aggregate. The BOP shows $1M per occurrence and $2M aggregate with a $500 deductible. Insureon also states that 90% of its customers choose general liability limits of $1M per occurrence and $2M aggregate. That is a published fact, not advice on which limit to pick.
How does the tool compare a quote with the published figure?
Choose “per month” or “per year” to match your quote. The tool turns it into a yearly amount and shows how far it is above or below the published figure as a percentage, or reports a match. The result is arithmetic only and does not judge the quote.
How are share of revenue and amount per employee calculated?
Share of revenue is the yearly total of the coverages ticked for the budget, taken from the published medians, divided by annual revenue and shown as a percentage. Amount per employee is that same yearly total divided by the number of employees. Both appear only after you type those figures under “More options”.
Why is a bundle not the sum of separate figures?
Adding the figures for two coverages does not give the price of a bundle, and the source says so. Insureon’s page states that a BOP combines general liability with commercial property insurance and typically costs less than buying them separately. A CPP also combines them and adds more flexible options.
What factors does Insureon list for these costs?
For errors and omissions, Insureon lists business type, claims history and policy limits. For general liability, it lists limits, deductible, business size, professional services, income and additional insured endorsements. For workers’ compensation, it lists employee count and occupational risks. For commercial auto, it lists limits, vehicle count and value, and driving records. This tool does not ask for these factors.
Sources (checked 15 October 2026): insureon.com
Worked examples
| Input | Result |
|---|---|
| Errors and omissions (E&O) | 2 coverage(s) added up from the published medians: $92 a month, $1,108 a year |
| Errors and omissions (E&O), quote $75 per month | Your quote of $75 a month ($900 a year) is 27.1% above the published median of $59 a month. |
| General liability, revenue $120,000 | 2 coverage(s) added up from the published medians: $92 a month, $1,108 a year |
| Errors and omissions (E&O), revenue $150,000 | 2 coverage(s) added up from the published medians: $92 a month, $1,108 a year |
Calculated by the tool above; open it with the same values to see each step.
Frequently asked questions
Is the real estate agent insurance cost shown here a quote?
No. The figures are published medians from Insureon, and the page gives no quote of its own. Quotes come from a licensed insurer or agent.
Where do the published figures come from?
They come from Insureon’s real estate agent and broker insurance cost page, updated 18 February 2025. Each figure is a median of quotes for that source’s customers, so it may differ from the quote you receive. The source uses the word “average” in places, but this tool treats each figure as a published median.
Does the tool recommend an insurer or a coverage amount?
No. It shows published figures and compares them with a quote you type. It does not recommend an insurer, a product, a coverage amount or a limit.
Does the tool ask for my contact details?
No. It does not ask for contact details, sell leads or refer to insurers.
Is there a sign-up or charge to use it?
No. The tool is free and needs no sign-up. Everything is calculated in your browser, so nothing is uploaded.
Can I compare a monthly quote with a yearly figure?
Compare like with like. Choose “per month” or “per year” in the quote field so it matches the published figure you are reading.
Is the result final?
No. The result is an estimate only, based on published medians and the quote you type.
Related tools
- Auto repair shop insurance cost: Built for a business that repairs vehicles, it shows published figures for that trade.
- Bakery insurance cost: Pulls up published numbers for a bakery.
- Cleaning Business Insurance Cost: Shows published figures for a cleaning business.
- Coffee shop insurance cost: Gives a sense of costs for a coffee shop, drawn from published data.
- Contractor Insurance Cost: For contractors, it lays out the published figures.
- Daycare Insurance Cost: Covers daycares, with published figures to compare.
- Business Insurance for Electricians Cost: Published figures for an electrician’s coverage cost are here.
- Food Truck Insurance Cost: Helps you check published figures for a food truck.
- Insurance cost by trade: A single list of every trade and small business cost tool.
- Business insurance costs: Groups the general business coverage cost tools together.