Personal trainer insurance cost
Pick a coverage to see the published figure, type a quote to compare, and tick coverages to add up a yearly budget.
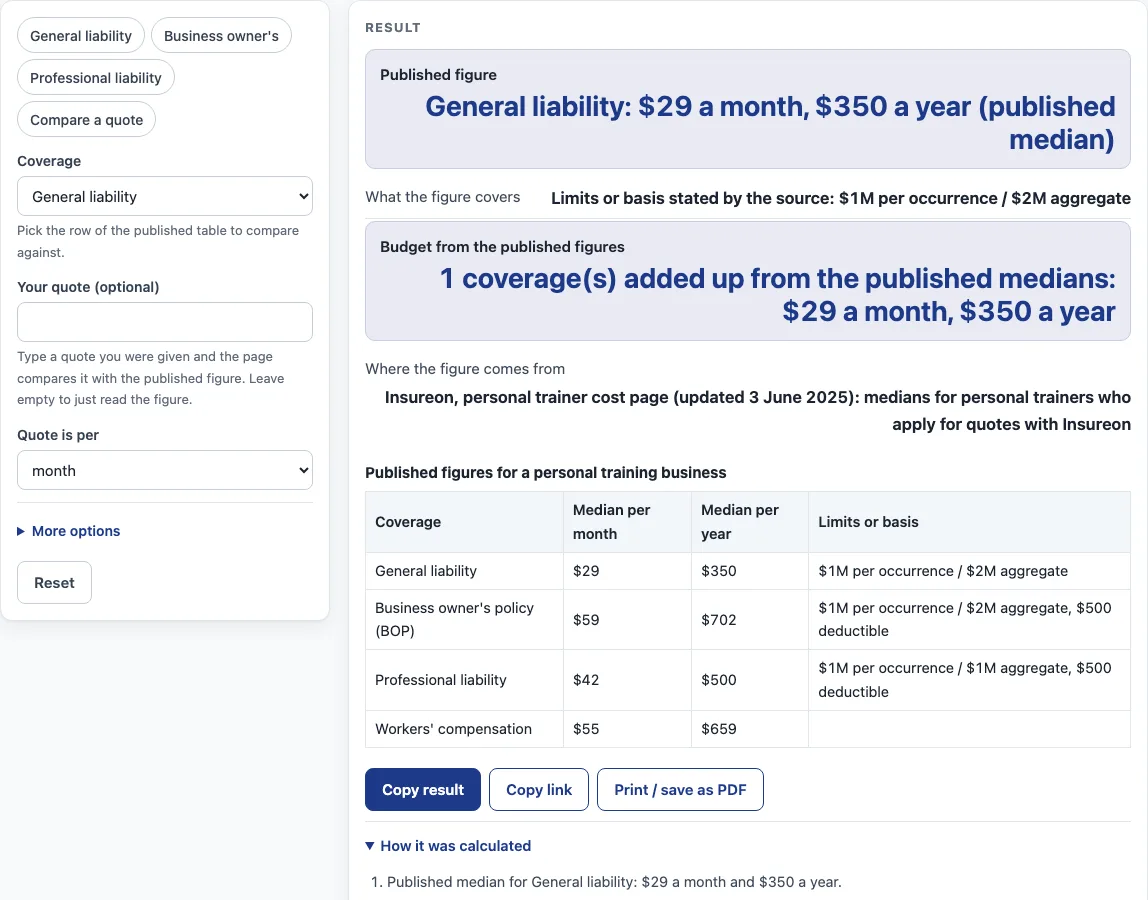
How to use the Personal Trainer Insurance Cost tool
- Start by picking the coverage row you want to check from the table: general liability, business owner’s policy (BOP), professional liability or workers’ compensation. Each row gives a monthly and an annual figure.
- Look at the limits beside that row. Where the source states them, they appear alongside the figure. For example, the BOP row lists $1M per occurrence / $2M aggregate with a $500 deductible. No limits are listed for workers’ compensation.
- Enter your quote in the quote field. Pick “per month” or “per year” so the quote matches the unit of the figure you are checking.
- Check the result. It shows how far your quote sits above or below the figure.
- Need more context? Open “More options” and enter your annual revenue, number of employees and any coverages you want to add to the budget. The tool then works out your share of revenue and the amount per employee.
- Adding more than one coverage? A total of separate medians does not equal the price of a bundle.
Treat every result as a rough estimate. To get a price for your own business, contact a licensed insurer or agent for a quote.
What does the published figure on this page measure?
The figure on this page is a median taken from Insureon’s personal trainer cost page, last updated 3 June 2025. It covers personal trainers who requested quotes through Insureon. Insureon’s sourcing statement calls it a median, yet the body text says average, so the wording varies across the source. This page follows the sourcing statement and uses “median”.
How do the monthly and yearly figures relate?
Every coverage carries its own monthly figure and its own yearly figure. Since twelve months make a year, 12 times the monthly figure might be expected to match the yearly one. Small gaps can appear. General liability shows $29 per month, and 12 times that is $348, whereas the published yearly figure is $350. Because these are separately published medians, the page displays each one as published instead of deriving one from the other.
How is a quote compared with the published figure?
The tool converts your quote into a yearly amount and measures it against the published yearly figure for the row you selected. The gap appears as a percentage above or below that figure, and an exact match is reported as a match. Your quote and the published figure need the same period, so pick “per month” or “per year” to fit how your quote is written.
How are the revenue and employee shares calculated?
Revenue share equals the yearly total of the ticked coverages, using published medians, divided by your annual revenue and expressed as a percentage. Dividing that same yearly total by the headcount gives the amount per employee. You see both results only once you enter revenue or employees under “More options”. They reflect your own inputs and leave the published figures unchanged.
Why is a bundle price not the sum of separate figures?
Each published figure is a median for a single coverage type, calculated separately. Add a general liability median to a workers’ compensation median and you get a total, but that total does not represent a bundle price. The page says so plainly, so read any sum as a simple addition of separate figures.
What do the limits in the published table mean?
Limits and deductibles appear only where Insureon states them. For general liability the source lists $1M per occurrence / $2M aggregate, and for the business owner’s policy it lists $1M per occurrence / $2M aggregate with a $500 deductible. Professional liability carries $1M per occurrence / $1M aggregate with a $500 deductible. No limits are stated for workers’ compensation, so none appear. The page offers no view on which limits fit any particular business.
Sources (checked 15 October 2026): insureon.com
Worked examples
| Input | Result |
|---|---|
| General liability | 1 coverage(s) added up from the published medians: $29 a month, $350 a year |
| General liability, quote $40 per month | Your quote of $40 a month ($480 a year) is 37.1% above the published median of $29 a month. |
| Business owner's policy (BOP), revenue $120,000 | 1 coverage(s) added up from the published medians: $29 a month, $350 a year |
| General liability, revenue $150,000 | 2 coverage(s) added up from the published medians: $88 a month, $1,052 a year |
Calculated by the tool above; open it with the same values to see each step.
Frequently asked questions
Is the personal trainer insurance cost on this page a quote?
No. The figures are published medians from Insureon, and the page gives no quote. Only a licensed insurer or agent can quote a policy.
Where do the published figures come from?
They come from Insureon’s personal trainer cost page, updated 3 June 2025. They are medians for personal trainers who apply for quotes with Insureon.
Does the tool send my numbers anywhere?
No. Everything is calculated in your browser, and nothing is uploaded. The page does not ask for contact details.
Why doesn’t 12 times the monthly figure equal the yearly figure?
Each figure is a separately published median, so one is not calculated from the other. The general liability figures show this: $29 per month is $348 a year, against a published $350 per year.
Does the tool recommend a coverage?
No. This site only calculates and explains. It does not recommend a coverage, a limit or an insurer. You can compare each row with your quote and read the limits shown for it.
Can I add the coverage figures together to get a bundle price?
No. The page says a sum of separate medians is not the price of a bundle.
Related tools
- Auto repair shop insurance cost: Figures released for that trade.
- Bakery insurance cost: Here are the numbers for bakeries.
- Cleaning Business Insurance Cost: Rates reported for this trade.
- Coffee shop insurance cost: A look at the published numbers for coffee shops.
- Contractor Insurance Cost: Published numbers for general contractors.
- Daycare Insurance Cost: Reported figures for childcare operators.
- Business Insurance for Electricians Cost: The published figures for electrical trades.
- Food Truck Insurance Cost: Mobile food vendors, with figures compiled for that trade.
- Insurance cost by trade: Every trade and small business cost tool, gathered in one list.
- Business insurance costs: Cost tools covering general business coverage.