Handyman Insurance Cost
Pick a coverage to see the published figure, type a quote to compare, and tick coverages to add up a yearly budget.
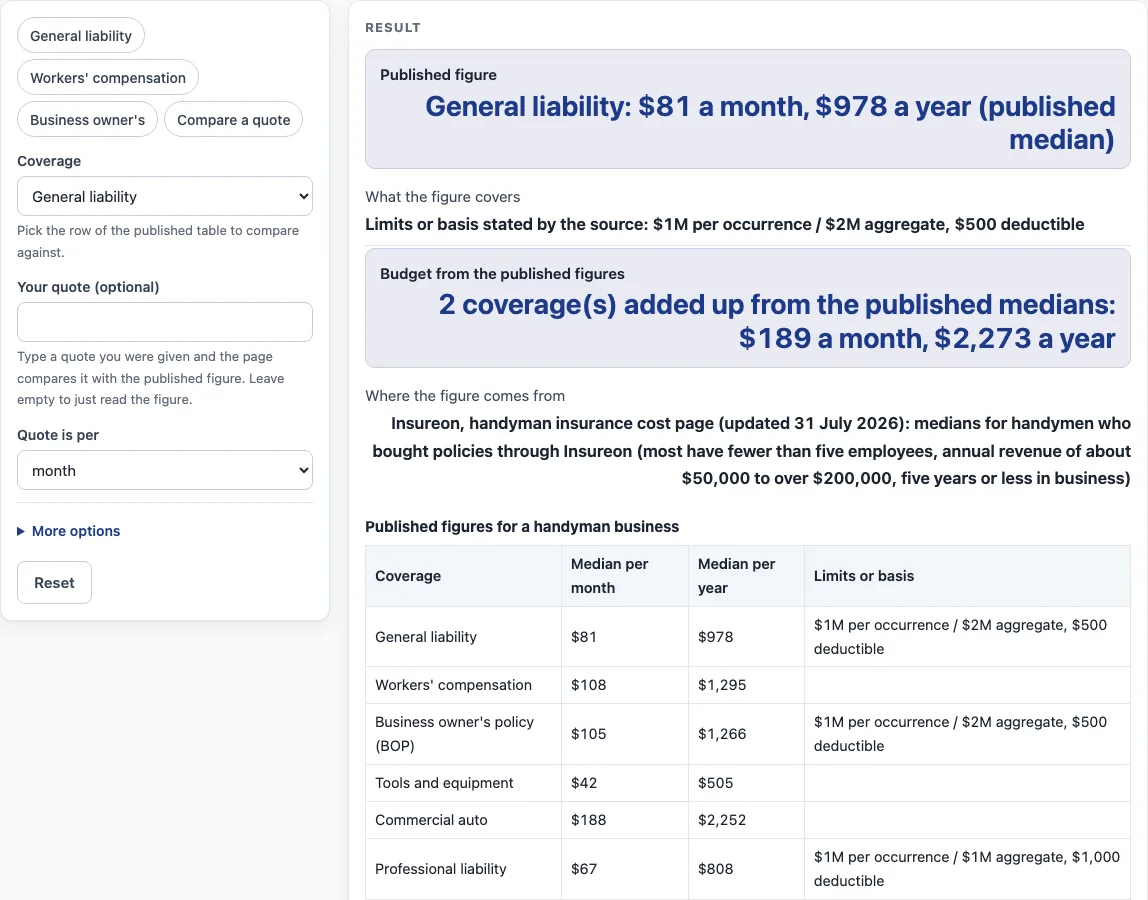
How to use the handyman insurance cost tool
- Under “Coverage”, pick the row you want to check in the published table. The table lists general liability, workers’ compensation, business owner’s policy (BOP), tools and equipment, commercial auto, professional liability, commercial umbrella, builder’s risk, and surety bonds.
- Read the published per month and per year figures shown for that row. Some rows also show the limits the source states, such as $1M per occurrence / $2M aggregate and a $500 deductible.
- Type a quote into “Your quote (optional)”. Set “Quote is per” to month or year so the tool compares like with like.
- Read “Your quote against it”. It shows how far your quote is above or below the published figure for that row.
- Open “More options” if you want more context. Enter “Annual revenue (optional)” and “Employees (optional)”. The tool then shows “Share of revenue” and “Per employee” for the ticked budget total.
- Under “More options,” tick “Add to budget” for each coverage you want counted. Treat the total as a sum of separate published figures. It is not the price of a bundle.
- Review the outputs together, and treat them as an estimate only.
Everything is calculated in your browser, so nothing you type is uploaded. There is no sign-up, and the page does not ask for contact details.
What does the published handyman insurance cost figure mean?
Each published figure is a median from Insureon for handymen who bought policies through that source. Most of those businesses have fewer than five employees, annual revenue of about $50,000 to over $200,000, and five years or less in business. The figure is a middle point of published data, not a price you will be offered.
How is the gap between a quote and the published figure worked out?
The tool turns a monthly quote into a yearly one by multiplying by 12, then subtracts the published yearly figure from it. A positive result means the quote is above the published number, and a negative result means it is below. The tool states the gap as that difference divided by the published yearly figure, shown as a percentage.
Which factors does Insureon list that change the cost?
Insureon’s page lists several factors that affect price. These include service risk, with the example that roofing costs more than wall repair, plus employees and subcontractors, revenue and payroll, equipment value and use, experience, location, limits and deductibles, and claims history. Your own factors may differ from the published median. The tool does not weigh these factors itself.
Why does adding the published figures not give a bundle price?
A sum of separate medians is not the price of a bundle. When you add coverages under “More options,” the total is only the sum of those separate published figures. The tool shows a note that one insurer pricing a bundle can differ from the sum and that your own quotes decide. This is an estimate only; get quotes from a licensed insurer or agent.
Why might other figures for handyman insurance cost differ?
Search-result text for an earlier Insureon handyman page gave general liability as $67 a month ($809 a year) and a BOP as $93 a month. The figures on this page come from the Insureon page opened on 15 October 2026, which shows $81 a month ($978 a year) for general liability and $105 a month ($1,266 a year) for a BOP. Sources differ by date, so check which version of a page a number comes from. Insureon also says its figures come from the median cost of policies but calls them averages, and this page calls them published medians. The result is an estimate only; get quotes from a licensed insurer or agent.
Sources (checked 15 October 2026): insureon.com
Worked examples
| Input | Result |
|---|---|
| General liability | 2 coverage(s) added up from the published medians: $189 a month, $2,273 a year |
| General liability, quote $105 per month | Your quote of $105 a month ($1,260 a year) is 28.8% above the published median of $81 a month. |
| Workers' compensation, revenue $120,000 | 2 coverage(s) added up from the published medians: $189 a month, $2,273 a year |
| General liability, revenue $150,000 | 2 coverage(s) added up from the published medians: $189 a month, $2,273 a year |
Calculated by the tool above; open it with the same values to see each step.
Frequently asked questions
Is the published figure an average handyman insurance cost?
This page calls them published medians. Insureon’s page, updated 31 July 2026, says its figures come from the median cost of policies but also calls them averages. They are for handymen who bought policies through that source.
Does this tool give me a quote?
No. The page does not give a quote, and the results are estimates only. A quote comes from a licensed insurer or agent.
Why might I see different figures from an older search result?
Search-result text for an earlier Insureon handyman page gave general liability as $67 per month ($809 per year) and a BOP as $93 per month. The figures on this page are from the page opened on 15 October 2026, so check the source page for the most current numbers.
What limits are shown with a figure?
Only some figures come with limits, and only when the source states them. For example, general liability is shown with $1M per occurrence / $2M aggregate and a $500 deductible. Rows without a stated limit show only the per month and per year figures.
Is anything I enter sent anywhere?
No. Everything is calculated in your browser, and nothing is uploaded. The page does not ask for contact details, sell leads, or refer you to insurers.
Can I use this to compare insurers?
No. The tool does not compare insurers or recommend one. It only compares your quote with the published figure for a coverage row.
Related tools
- Insurance cost by trade: the hub listing every trade page with published figures.
- Business insurance costs: the hub for coverage-type pages such as general liability and workers’ comp.
- Contractor Insurance Cost: Use this when your handyman work is closer to general contracting.
- Electrician insurance cost: Use this when your trade is electrical work.
- HVAC insurance cost: Use this when your trade is heating and cooling work.
- Lawn care business insurance cost: Use this when your work is outdoor property care.
- Cleaning Business Insurance Cost: Use this when you run a cleaning service instead of repair work.
- Auto repair shop insurance cost: Use this when your business runs out of a repair shop.