Commercial Property Insurance Cost
Pick a business type to see the published median, then type a quote to compare it.
This page shows what commercial property insurance typically costs, using published figures and comparing them with a quote you enter. The numbers come from Insureon’s commercial property cost page, last revised 9 March 2026. They are published medians for small-business customers, not rates this site offers.
Everything runs in your browser. The tool is free, requires no account, and does not upload anything you type. Choose a business type and it displays the published figure per month and per year. Enter a quote and it shows how far that quote sits above or below the published figure.
Treat every result as a rough estimate, not a quote. For actual pricing, contact a licensed insurer or agent.
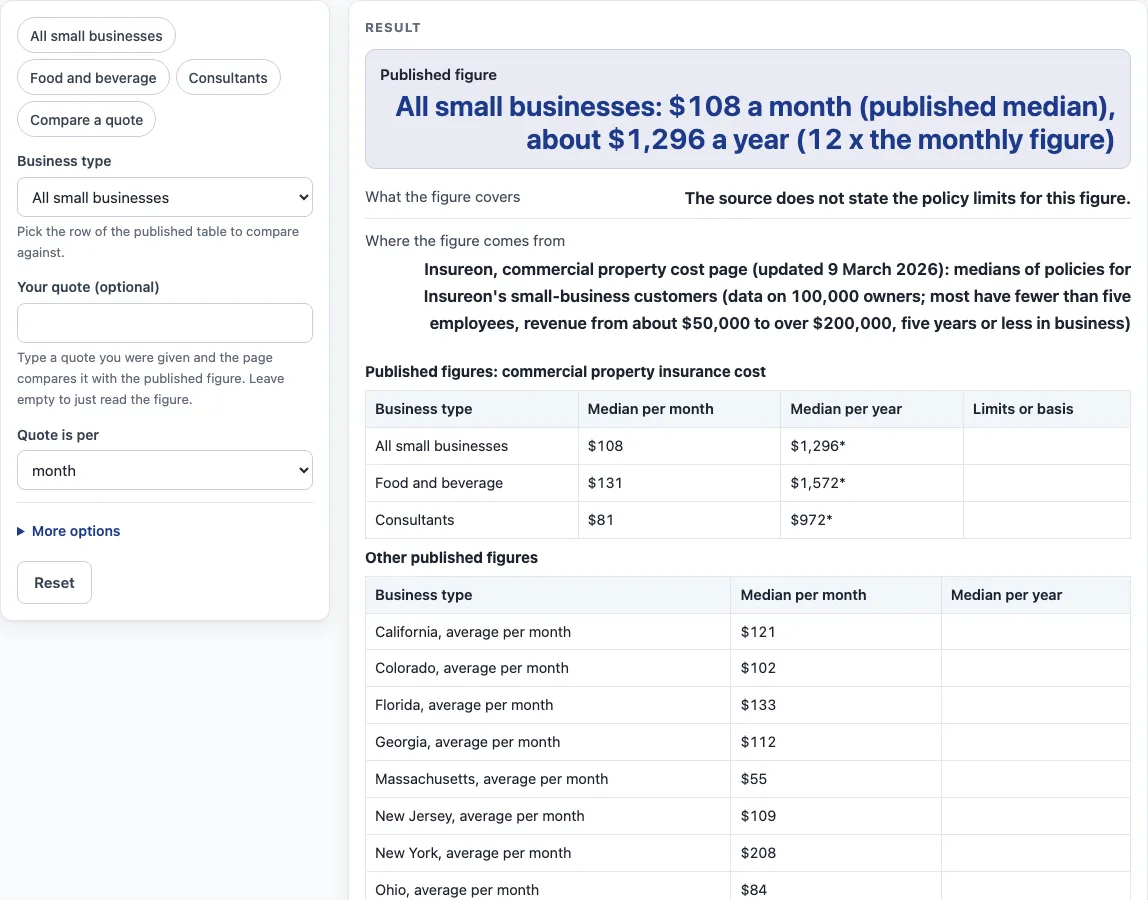
How to use the commercial property insurance cost tool
- Locate the row in the published table that matches your business type. The rows read “All small businesses”, “Food and beverage” and “Consultants”.
- Take the published figure from that row. The tool displays it monthly and yearly; the source publishes the monthly median, and the yearly number is that amount times 12, marked with an asterisk.
- If you have a quote, type it in (optional). Enter the amount and pick “per month” or “per year”.
- Review the comparison. It shows how far your quote sits above or below the published figure.
- Look at the “What the figure covers” line, which lists limits only where the source states them for the figure.
- Open “More options” (optional). Add annual revenue and the number of employees. As you type, the tool calculates the published yearly figure as a share of revenue and as an amount per employee, along with your quote as a share of revenue.
- Take the result as a rough estimate only, and get quotes from a licensed insurer or agent.
All of the steps run in your browser, so nothing you type is uploaded. Adjust the business type or quote whenever you like and the result updates.
How is the commercial property insurance cost figure on this page calculated?
Every figure here comes from Insureon’s commercial property cost page, last revised 9 March 2026, and the monthly figures are published medians. A median is the middle value when the figures are sorted from lowest to highest. The tool adds no estimate of its own and does not give a quote.
Data in the source covers 100,000 owners of small businesses. Most have fewer than five employees, revenue from about $50,000 to over $200,000, and five years or less in business. Below are the published monthly medians. No yearly figures appear in the source, so each yearly amount is the monthly one times 12.
- All small businesses: $108 per month, $1,296 per year
- Food and beverage: $131 per month, $1,572 per year
- Consultants: $81 per month, $972 per year
That page also gives a wider picture, dated 9 March 2026. It states that 46% of its customers pay less than $100 a month and 22% pay $100 to $200 a month. It gives an annual range of under $350 to over $15,000, an average deductible of $1,000, and says that 87% of customers choose a BOP with $1M / $2M limits. That last figure describes what customers chose. It is not a recommendation for any business.
State averages per month from that page also appear here, such as California at $121, New York at $208, Texas at $163 and Washington at $38. They serve as context only, not rows to compare a quote against. Gaps between states appear as published, and the page offers no explanation for them in its text.
Why is a combined quote not the sum of separate figures?
A sum of separate medians is not the price of a bundle, and this page says so. If you add a property median to a liability median, the total does not show what a combined policy would cost.
For that reason, comparisons run against one published row at a time. You pick “per month” or “per year” for your quote, and the tool converts the figure before comparing. The difference shown is only the gap between your number and that published median, so the result is an estimate only; get quotes from a licensed insurer or agent.
Sources (checked 15 October 2026): insureon.com
Worked examples
| Input | Result |
|---|---|
| All small businesses | All small businesses: $108 a month (published median), about $1,296 a year (12 x the monthly figure) |
| All small businesses, quote $135 per month | Your quote of $135 a month ($1,620 a year) is 25% above the published median of $108 a month. |
| Food and beverage, revenue $120,000 | Food and beverage: $131 a month (published median), about $1,572 a year (12 x the monthly figure) |
| All small businesses, revenue $150,000 | All small businesses: $108 a month (published median), about $1,296 a year (12 x the monthly figure) |
Calculated by the tool above; open it with the same values to see each step.
Frequently asked questions
What is commercial property insurance cost?
It is the amount a business pays for commercial property insurance. This page reports published medians for that cost, taken from Insureon’s commercial property cost page, dated 9 March 2026.
Is the figure on this page a quote?
No. Each figure is a published median or range from the named source. The tool gives no quote and offers only an estimate, so request quotes from a licensed insurer or agent.
What does the 46% figure mean?
Insureon’s commercial property page, dated 9 March 2026, reports that 46% of its customers pay less than $100 a month. That share describes a group of customers, not a price you will be charged.
Why is the annual range so wide?
According to the source (dated 9 March 2026), the annual range runs from under $350 to over $15,000. A single median cannot describe every customer across that span.
Can I enter my own quote and compare it?
Yes. Enter a quote, pick “per month” or “per year”, and the tool shows how far it sits above or below the published figure.
Does the tool store the numbers I enter?
All calculations run in your browser, and nothing is uploaded. The page does not request contact details.
Does the page show figures by state?
Yes, as context. The tool lists average monthly figures for ten states, drawn from Insureon’s commercial property page (dated 9 March 2026). Compare a quote only against the business-type rows.
Is there a commercial building or property insurance calculator?
This page is the nearest option: it shows the published commercial property median for “All small businesses”, “Food and beverage” or “Consultants” and compares a quote you type in. It does not work out a premium from a building’s value, age, construction or location. A commercial building insurance calculator that asks for those details is a different kind of tool, so get a quote from a licensed insurer or agent.
Related tools
- Business Insurance Costs: Start here to see every business insurance cost tool gathered in one spot.
- BOP Insurance Cost: Pick this one for the published figures on a business owner’s policy.
- Commercial Auto Insurance Cost: Best suited to questions about insurance for vehicles used in a business.
- Cyber Liability Insurance Cost: Published figures for cyber liability coverage are listed here.
- Errors and Omissions Insurance Cost: For errors and omissions coverage, this page lists the published figures.
- General Liability Insurance Cost: Covers general liability coverage with published figures you can check.
- Small Business Insurance Cost: A quick overview of published figures aimed at small businesses.
- Workers Comp Calculator: Compare a workers’ compensation quote against a published figure with this calculator.
- Workers Comp Insurance Cost: Workers’ compensation insurance figures, as published, are on this page.