BOP Insurance Cost
Pick a business type to see the published median, then type a quote to compare it.
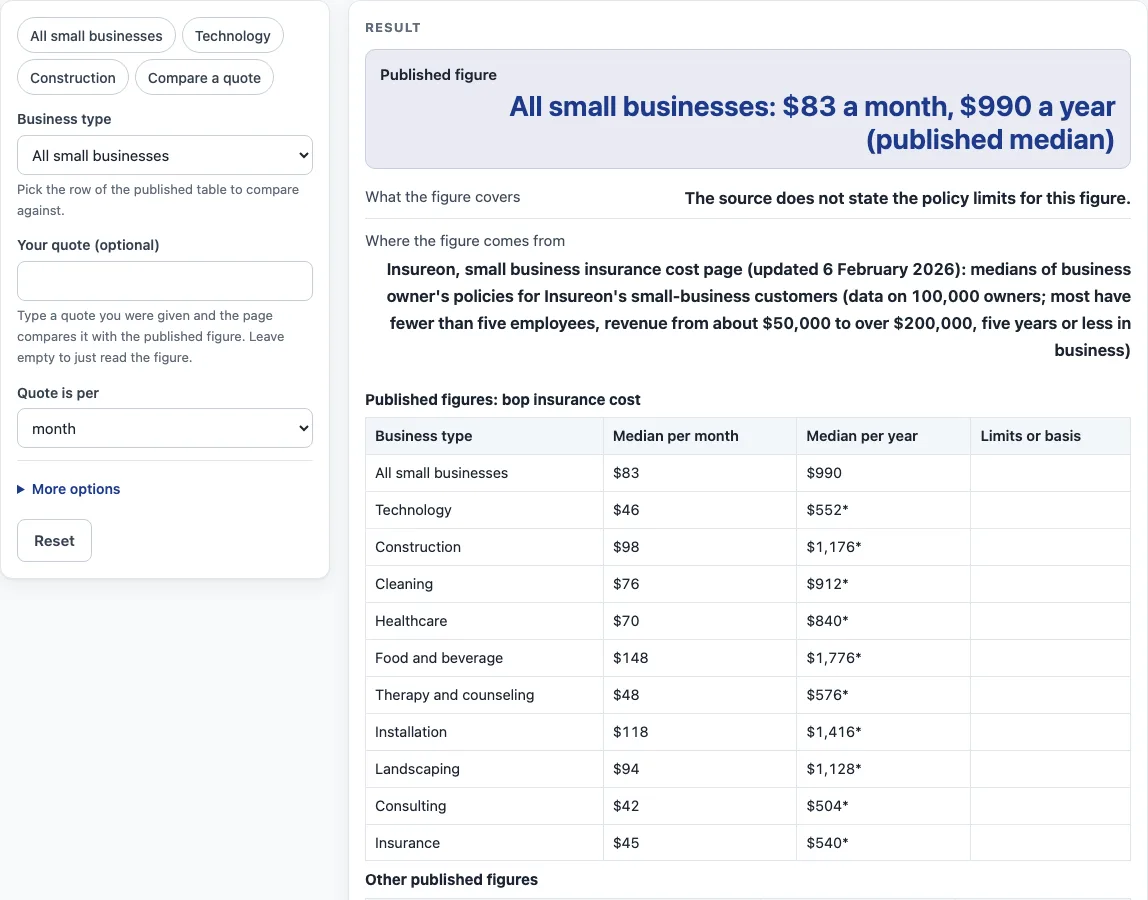
How to use the BOP insurance cost tool
- Find the row in the table that matches your business type. The “All small businesses” row covers the source’s whole customer group.
- Read the published figure per month and per year for that row. Only the “All small businesses” row publishes both; for the other rows the yearly figure is the monthly one times 12, marked with an asterisk.
- If you have a quote, type it into the quote field. Choose “per month” or “per year” so the tool reads the amount correctly.
- Read how far the quote is above or below the published figure.
- Open “More options” if you want to add annual revenue and number of employees.
- Read the share of revenue and the amount per employee that appear once you have typed those values.
- Check the “What the figure covers” line, which shows limits only where the source states them for that row. A separate line shows your quote as a share of revenue if you typed revenue and a quote.
Everything is calculated in your browser, and nothing you type is uploaded. Because the figures are medians from a published source, use the results to compare numbers, not as a price. The result is an estimate only; get quotes from a licensed insurer or agent.
What does the bop insurance cost figure on this page show?
The figures are published medians from Insureon’s small business insurance cost page, updated 6 February 2026. They come from data on 100,000 owners, most of whom have fewer than five employees, revenue from about $50,000 to over $200,000, and five years or less in business.
Each business type row shows a monthly and a yearly figure. For example, “All small businesses” is $83 per month and $990 per year. For “Food and beverage” the source publishes $148 per month, and the tool shows $1,776 per year as that figure times 12. Each row is a separate median, so a sum of rows is not the price of a bundle.
Insureon’s BOP page (updated 17 April 2026) adds context. It states that 25% of its customers pay less than $50 a month and 33% pay $50 to $100 a month. Retail, restaurants and auto repair shops pay $131 to $190 a month. Annual costs range from around $400 to over $6,000, with an average deductible of $500. The same page states that 79% of customers choose $1M per occurrence / $2M aggregate limits and 18% choose $2M / $4M. It also lists state averages per month, such as California at $79, New York at $97 and Texas at $97. These are shown as context only, not as rows to compare a quote against.
How does the tool compare a quote with the published figure?
The tool puts your quote and the published figure in the same unit before comparing them. A monthly quote is multiplied by 12 to get a yearly amount, and a yearly quote is divided by 12 to get a monthly amount. The tool then shows the difference as a percentage above or below the published median.
When you type annual revenue, the share of revenue is the published yearly figure divided by annual revenue, and a separate line divides your yearly quote by it. When you type the number of employees, the amount per employee is the published yearly figure divided by that number. Both are simple division, so the result depends entirely on the numbers you enter.
One row needs a note. Insureon’s BOP page text (updated 17 April 2026) gives consultants $55 a month, but its cost-by-coverage table (updated 6 February 2026) gives $42. This tool uses the table, so “Consulting” shows $42 per month and $504 per year.
Sources (checked 15 October 2026): insureon.com · insureon.com
Worked examples
| Input | Result |
|---|---|
| All small businesses | All small businesses: $83 a month, $990 a year (published median) |
| All small businesses, quote $105 per month | Your quote of $105 a month ($1,260 a year) is 27.3% above the published median of $83 a month. |
| Technology, revenue $120,000 | Technology: $46 a month (published median), about $552 a year (12 x the monthly figure) |
| All small businesses, revenue $150,000 | All small businesses: $83 a month, $990 a year (published median) |
Calculated by the tool above; open it with the same values to see each step.
Frequently asked questions
What is bop insurance cost?
Bop insurance cost is the price of a business owner’s policy, which Insureon describes as general liability plus commercial property. This page shows published medians for that price by business type. It also lets you compare a quote you type in.
Is the figure shown the price I will pay?
No. The figure is a published median from Insureon (page updated 6 February 2026), based on its customer data. The result is an estimate only; get quotes from a licensed insurer or agent.
Why does Consulting show a different figure than Insureon’s BOP text?
Insureon’s BOP page text (updated 17 April 2026) gives consultants $55 a month, while its cost-by-coverage table (updated 6 February 2026) gives $42. This tool uses the table, so it shows $42 per month and $504 per year for Consulting.
Can I add two business type figures together?
No. Each row is a separate median, and this page states that a sum of separate medians is not the price of a bundle. The tool compares a quote with one row at a time.
Does the tool recommend an insurer, a coverage amount or a limit?
No. The tool only calculates and explains published figures. It does not suggest an insurer, a product, a coverage amount or a limit. Insureon’s figures on limits are shown as reported context.
Is anything I type sent anywhere?
No. Everything is calculated in your browser, and nothing is uploaded. The page does not ask for contact details, does not sell leads and does not refer you to insurers.
Related tools
- Business Insurance Costs: Use it when you want every business insurance cost tool in one place.
- Commercial Auto Insurance Cost: Use it when your business owns or uses vehicles and you want to compare published auto figures.
- Commercial Property Insurance Cost: Use it when you want published figures for insuring a business property.
- Cyber Liability Insurance Cost: Use it when you want to see published figures for cyber liability coverage.
- Errors and Omissions Insurance Cost: Use it when you want published figures for professional errors and omissions coverage.
- General Liability Insurance Cost: Use it when you want published figures for general liability coverage.
- Small Business Insurance Cost: Use it when you want a broader view of published small business insurance figures.
- Workers Comp Calculator: Use it when you want to work through workers’ compensation figures with the tool.
- Workers Comp Insurance Cost: Use it when you want published figures for workers’ compensation insurance.