Auto repair shop insurance cost
Pick a coverage to see the published figure, type a quote to compare, and tick coverages to add up a yearly budget.
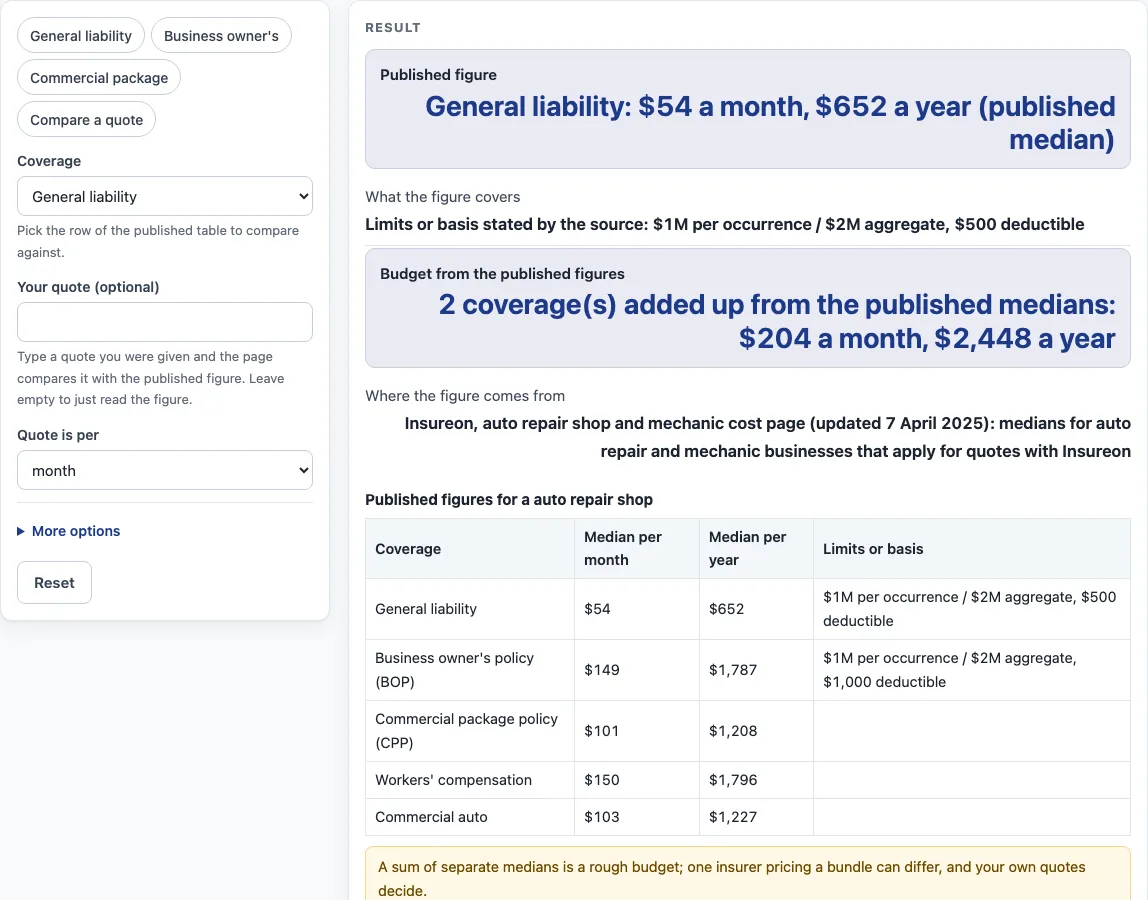
How to use the auto repair shop insurance cost tool
- Find the row of the published table for the coverage you want to look at: General liability, Business owner’s policy (BOP), Commercial package policy (CPP), Workers’ compensation or Commercial auto.
- Read the published figure for that row. It is shown per month and per year.
- Read the limits if the source states them. General liability and Business owner’s policy (BOP) have limits and deductibles listed. The other rows have none listed on this page.
- Type a quote into the quote field and choose “per month” or “per year” to match the period of your quote.
- Read the output that shows how far the quote is above or below the published figure.
- Open “More options” and enter annual revenue and employees if you want a share of revenue and an amount per employee.
- In “More options,” choose which coverages to add to the budget.
- Read the total and keep in mind that a sum of separate medians is not the price of a bundle.
- Treat the result as an estimate only. Quotes come from a licensed insurer or agent.
Everything runs in your browser, so nothing you type is uploaded. Use the same period, per month or per year, for the quote and for the figure you compare it with.
What does the published auto repair shop insurance cost figure measure?
The figures are published medians from Insureon’s auto repair shop and mechanic cost page, updated 7 April 2025, for auto repair and mechanic businesses that applied for quotes with Insureon. A median is the middle value of a set of numbers, so the published figure sits at the point where half the values are above it and half are below. The page headings use the word “average”, but its methodology describes these numbers as medians, so this guide uses “median” throughout.
How is a quote compared with the published figure?
The tool turns your quote into a yearly amount and compares it with the published yearly figure for the row, showing the gap as a percentage above or below, or as a match. Compare like with like by matching the period, so choose “per month” or “per year” to match how your quote is written. For example, the General liability row shows $54 per month and $652 per year.
Why are limits and deductibles shown for only some rows?
The page shows limits when the source states them. For General liability, the published limits are $1M per occurrence and $2M aggregate, with a $500 deductible. For Business owner’s policy (BOP), they are $1M per occurrence and $2M aggregate, with a $1,000 deductible. The other rows have no limits listed here. Two figures with different limits or deductibles do not describe the same thing, so check those details before you compare a quote with a row. The tool does not suggest which limit or deductible to choose.
How are share of revenue and amount per employee worked out?
Share of revenue divides the yearly total of the coverages ticked for the budget, taken from the published medians, by the annual revenue you enter, and shows the result as a percentage. Amount per employee divides that same yearly total by the number of employees you enter. These two results describe the budget you built from the published figures, not a quote.
Why is a total of separate figures not the price of a bundle?
Each published median is calculated on its own row. Adding several of them gives a sum, not the price of a package of coverages. The page says so directly. Only a quote from a licensed insurer or agent can show the cost of a bundle.
Sources (checked 15 October 2026): insureon.com
Worked examples
| Input | Result |
|---|---|
| General liability | 2 coverage(s) added up from the published medians: $204 a month, $2,448 a year |
| General liability, quote $70 per month | Your quote of $70 a month ($840 a year) is 28.8% above the published median of $54 a month. |
| Business owner's policy (BOP), revenue $120,000 | 2 coverage(s) added up from the published medians: $204 a month, $2,448 a year |
| General liability, revenue $150,000 | 2 coverage(s) added up from the published medians: $203 a month, $2,439 a year |
Calculated by the tool above; open it with the same values to see each step.
Frequently asked questions
Is this the price I will pay for auto repair shop insurance?
No. The figures are published medians from Insureon, and the page gives no quote. Your own quote from a licensed insurer or agent is the figure that applies to your business.
Where do the published figures come from?
They come from Insureon’s auto repair shop and mechanic cost page, updated 7 April 2025. They are medians for auto repair and mechanic businesses that applied for quotes with Insureon.
Does the tool store my numbers or contact details?
Everything is calculated in your browser, and nothing is uploaded. The page does not ask for contact details, sell leads or refer to insurers.
Why does the page use “average” in some headings but “median” elsewhere?
The headings use the word average, while the methodology describes the figures as medians. The figures are medians, so this page uses that word consistently in its explanations.
Which coverages do the figures include?
The table lists General liability, Business owner’s policy (BOP), Commercial package policy (CPP), Workers’ compensation and Commercial auto. Each row is a separate median, and you can add rows to the budget under “More options”.
Can this tool help me choose an insurer or coverage?
No. The tool only calculates and explains the published figures and compares them with a quote you type in. It does not recommend an insurer, a product or a coverage amount. Decisions about coverage are made with a licensed insurer or agent.
Related tools
- Bakery insurance cost: Use it to read published figures for a bakery and compare them with a quote.
- Cleaning Business Insurance Cost: Use it if your business is a cleaning service and you want to check a quote against published figures.
- Coffee shop insurance cost: Use it for a coffee shop when you want to see how a quote sits against its published medians.
- Contractor Insurance Cost: Use it for contracting work when you want to read published figures next to a quote.
- Daycare Insurance Cost: Use it for a daycare when you want to compare a quote with published medians.
- Business Insurance for Electricians Cost: Use it for an electrical business to read its published figures alongside a quote.
- Food Truck Insurance Cost: Use it for a food truck when you want to see how a quote compares with published figures.
- Hair salon insurance cost: Use it for a hair salon to check a quote against its published medians.
- Insurance cost by trade: Use it to see all the trade and small business cost tools in one list.
- Business insurance costs: Use it for the general business coverage cost tools.